Ethical Design: Evaluating Digital and IRL Experiences (and how one might support or hinder the other)

During the Winter 2022 intercession, I took part in the Living Lab General Education Seminar which is described on its website as follows:

The seminar is designed to make General Education more visible in our classrooms and courses. We will build an engaging environment for learning through exploration, implementation, and assessment of a variety of proven teaching practices using Oral Communication, Quantitative Literacy, Reading, Writing as our focus this year.

Living Lab General Education Seminar

In this course we learned how to apply High Impact Educational Principles and strategies for Place-Based Learning to create rewarding learning experiences for our students and colleagues.

The culmination of the course was to create a new or redesigned course assignment or project targeting one of the General Education Learning Goals and to implement it during the Spring 2022 semester. A complete description of my activity is located in the L4: Living Lab Learning Library.

The Exercise 

In a Data for Good lecture at Columbia’s Data Science Institute, dana boyd of Data+Society told the audience that her proudest achievements are often when she convinces a client not to create something that can potentially do harm.  

When does it make sense to NOT make a digital version of something that would be better designed IRL? Are there activities that are more suited to online than IRL? Or are there cases where a combination of both are appropriate? 

In this exercise, I shared a few articles about online activities that have had an impact on real life. We discussed both positive and negative reviews of online activities, including Pokemon Go (The Guardian), which is often  discussed in terms of its getting gamers to be more social and active, to Instagram (Wall Street Journal), which has been shown to have a negative effect on the self-esteem of teenaged girls. A third example was on how social media use during the pandemic is exacerbating to the political polarization of America (Harvard Berkman Klein Center) by removing the public commons from physical space to largely anonymous forums. 

After discussing these articles, students formed breakout groups to find a news article about an online activity and discussed the pros and cons of that activity online. And to also discuss how that activity could be replaced by or combined with an “In Real Life” (IRL) activity to improve the experience. Finally, they posted a reflection on the exercise to the class Slack group. 

High Impact Learning

This activity focuses on three learning outcomes: Reading, Information Literacy and Ethical Thinking. Students are asked to read an assigned text describing Digital vs IRL spaces and then in select an example from the reading of a digital experience that might be better In Real Life or paired with an IRL experience. After discussing in groups, they then share back to the class what they discussed and finally post a reflection on course discussion board about their understanding of the pros and cons of digital vs IRL for the chosen scenario.  

To address Information Literacy, students must find one additional example of digital applications where the IRL experience takes precedence over digital. What might someone gain from a physical experience that they can’t get from digital? When might a digital application enhance the IRL experience?  

And to expand their understanding of who is impacted by their design decisions, they then work in groups to make a stakeholder map (Giordano et al, 2018) showing who is affected by the designed experience of their chosen example. Who is participating in the experience? Who else might be affected by the experience? Or harmed? Who might be left out?  

In addition to the reading, information literacy and ethical thinking student learning outcomes, students gain gain from two High Impact Education Practices: Place Based Learning and Collaborative Assignments.  

Place-Based Learning: Students consider the physical and embodied experiences of IRL versus digital experiences  

Collaborative Assignments: Students participate in discussion of the pros and cons of selected digital experiences 

Outcomes and Future Development

This activity was part of the Ethics and Accessibility lecture in Week 7 of the Spring 2022 semester. It took a little over a half hour to complete. There was no out-of-class time except if a student wishes to post their reflection after class. If we had more time (and were not otherwise online this week) we might have been able to go outside and play Pokemon Go or survey people about their online and offline political activity on campus grounds. We may still try to create an online/IRL activity during a later session and follow up with a stakeholder map, which we did not have time to do. 

The activity was low stakes and ungraded. The only preparation was to find three articles to discuss as examples of Online activities that either replace or compromise IRL experiences. Because this assignment is ungraded, I plan to use it as part of the participation grade. I do not believe my course is part of the college-wide general education assessment initiative. It is an elective. 

Students enjoyed discussing online versus “In Real Life” very much. They are very aware of online activities that are creating unrealistic expectations for their real-life relationships and are concerned about exacerbating these experiences through their design careers. I would like to refine the activity and possibly replace a duller accessibility study that they do for credit and that could be done in class in groups or as a demonstration. Not being able to go outside or actually be IRL was an issue with this activity, though some students mentioned that it made it easier for everyone in their group to search for articles since they were all sitting at a computer anyway. 

Resources and Reflections 

My activity presentation for the Living Lab course is openly available at https://cuny907-my.sharepoint.com/:p:/g/personal/noreen_whysel27_login_cuny_edu/EeDP7sDKTAROh1Nle8uKlagB5bMXEem7EM4k6Lvh7nagBA?e=FgnQIx 

You can also read about this and other OER activities on the course blog at https://openlab.citytech.cuny.edu/l4/2022/03/28/ethical-design-evaluating-digital-and-irl-experiences-and-how-one-might-support-or-hinder-the-other/

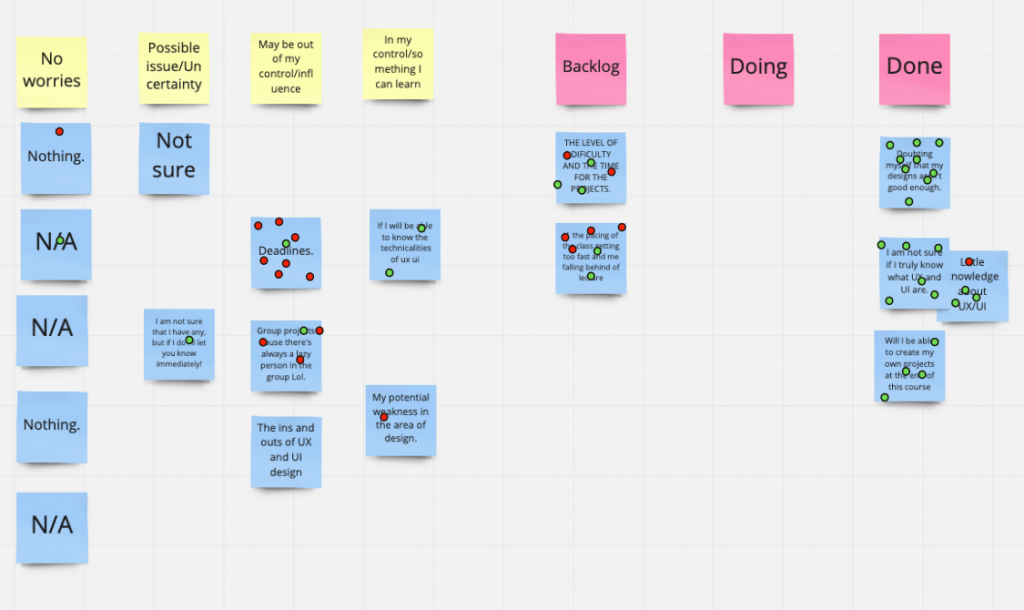
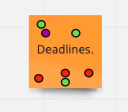
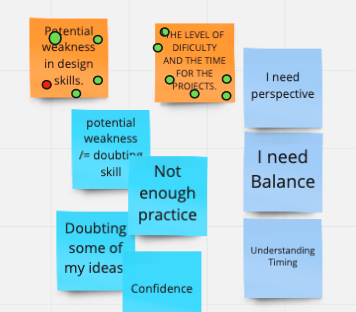
The Slack channel where students posted their reflections is a private discussion space for students of the HE93 section of COMD3562. I will post an image with student names anonymized to show an example of the written output from this assignment. Students who wish to post their reflections publicly will be able to reply to the post on Open Lab. 

This article was originally posted on March 28, 2022 on CUNY Open Lab.

Designing Respectful Technology

Note: this article was originally published as Designing Respectful Tech: What is your relationship with technology? at Boxes and Arrows on February 24, 2022

You’ve been there before. You thought you could trust someone with a secret. You thought it would be safe, but found out later that they blabbed to everyone. Or, maybe they didn’t share it, but the way they used it felt manipulative. You gave more than you got and it didn’t feel fair. But now that it’s out there, do you even have control anymore?

Ok. Now imagine that person was your supermarket. 

Or your doctor. 

Or your boss.

Do you have a personal relationship with technology?

According to research at the Me2B Alliance, people do feel they have a relationship with technology. It’s emotional. It’s embodied. And it’s very personal.

How personal is it? Think about what it would be like if you placed an order at a cafe and they already knew your name, your email, your gender, your physical location, what you read, who you are dating, and that, maybe, you’ve been thinking of breaking up.

Source: “If your shop assistant was an app (hidden camera),” Forbrugerrådet Tænk (Danish Consumer Council), December 2014 (YouTube).

We don’t approve of gossipy behavior in our human relationships. So why do we accept it with technology? Sure, we get back some time and convenience, but in many ways it can feel locked in and unequal.

The Me2B Relationship Model

At the Me2B Alliance, we are studying digital relationships to answer questions like “Do people have a relationship with technology?” (They feel that they do). “What does that relationship feel like?” (It’s complicated). And “Do people understand the commitments that they are making when they explore, enter into and dissolve these relationships?” (They really don’t).

It may seem silly or awkward to think about our dealings with technology as a relationship, but like messy human relationships there are parallels. The Me2BA commitment arc with a digital technology resembles German psychologist George Levenger’s ABCDE relationship model 1, shown by the Orange icons in the image below. As with human relationships, we move through states of discovery, commitment and breakup with digital applications, too.

Source: Me2B Alliance, 2021

Our assumptions about our technology relationships are similar to the ones we have about our human ones. We assume when we first meet someone there is a clean slate, but this isn’t always true. There may be gossip about you ahead of your meeting. The other person may have looked you up on LinkedIn. With any technology, information about you may be known already, and sharing that data starts well before you sign up for an account.

The Invisible Parallel Dataverse

Today’s news frequently covers stories of personal and societal harm caused by digital media manipulation, dark patterns and personal data mapping. Last year, Facebook whistleblowerFrances Hauser exposed how the platform promotes content that they know from their own research causes depression and self-harm in teenage girls. They know this because they know what teenage girls click, post and share.

Technology enables data sharing at every point of the relationship arc, including after you stop using it. Worryingly, even our more trusted digital relationships may not be safe. The Me2B Alliance uncovered privacy violations in K-12 software, and described how abandoned website domains put children and families at risk when their schools forget to renew them. 

Most of the technologies that you (and your children) use have relationships with third party data brokers and others with whom they share your data. Each privacy policy, cookie consent and terms of use document on every website or mobile app you use defines a legal relationship, whether you choose to opt in or are locked in by some other process. That means you have a legal relationship with each of these entities from the moment you accessed the app or website, and in most cases, it’s one that you initiated and agreed to.

All the little bits of our digital experiences are floating out there and will stay out there unless we have the agency to set how that data can be used or shared and when it should be deleted. The Me2B Alliance has developed Rules of Engagement for respectful technology relationships and a Digital Harms Dictionary outlining types of violations, such as:

  • Collecting information without the user’s awareness or consent; 
  • contracts of adhesion, where users are forced to agree with terms of use (often implicitly) when they engage with the content; 
  • Loss or misuse of personally identifiable information; and 
  • Unclear or non-transparent information describing the technology’s policies or even what Me2B Deal they are getting.
Respectful relationships. Data minimization includes: No gossip, no eavesdropping, no stalking. Individual control and autonomy includes: No manipulation, no coercion. Respectful defaults includes Progressive Consent.
Source: Noreen Whysel, Me2B Alliance 2021. Image (right): Pixabay

Respectful technology relationships begin with minimizing the amount of data that is collected in the first place. Data minimization reduces the harmful effects of sensitive data getting into the wrong hands. 

Next, we should give people agency and control. Individual control over one’s data is a key part of local and international privacy laws like GDPR in Europe, and similar laws in CaliforniaColoradoand Virginia, which give consumers the right to consent to data collection, to know what data of theirs is collected and to request to view the data that was collected, correct it, or to have it permanently deleted.

Three Laws of Safe and Respectful Design

In his short story, I, Robot, Isaac Asimov introduced the famous “Three Laws of Robotics,” an ethical framework to avoid harmful consequences of machine activity. Today, IAs, programmers and other digital creators make what are essentially robots that help users do work and share information. Much of this activity is out of sight and mind, which is in fact how we, the digital technology users, like it. 

But what of the risks? It is important as designers of these machines to consider the consequences of the work we put into the world. I have proposed the following corollary to Asimov’s robotics laws:

  • First Law: A Digital Creator may not injure a human being or, through inaction, allow a human being to come to harm.
  • Second Law: A Digital Creator must obey the orders given by other designers, clients, product managers, etc. except where such orders would conflict with the First Law.
  • Third Law: A Digital Creator must protect its own existence as long as such protection does not conflict with the First or Second Law.1

Mike Monteiro in his well-known 2014 talk at An Event Apart on How Designers are Destroying the World discusses the second and third law a lot. While we take orders from the stakeholders of our work—the client, the marketers and the shareholders we design for—we have an equal and greater responsibility to understand and mitigate design decisions that have negative effects.

A Specification for Safe and Respectful Technology

The Me2B Alliance is working on a specification for safe and respectfully designed digital technologies—technologies that Do No Harm. These product integrity tests are conducted by a UX Expert and applied to each commitment stage that a person enters. These stages range from first-open, location awareness, cookie consent, promotional and loyalty commitments, and account creation, as well as the termination of the relationship.

Abby Covert’s IA Principles—particularly Findable, Accessible, Clear, Communicative and Controllable—are remarkably appropriate tests for ensuring that the people who use digital technologies have agency and control over the data they entrust to these products:

Findable: Are the legal documents that govern the technology relationship easy to find? What about support services for when I believe my data is incorrect, or being used inappropriately? Can I find a way to delete my account or delete my data?

Accessible: Are these resources easy to access by both human and machine readers and assistive devices? Are they hidden behind some “data paywall” such as a process that requires a change of commitment state, i.e. a data toll, to access?

Clear: Can the average user read and understand the information that explains what data is required for what purpose? Is this information visible or accessible when it is relevant?

Communicative: Does the technology inform the user when the commitment status changes? For example, does it communicate when it needs to access my location or other personal information like age, gender, medical conditions? Does it explain why it needs my data and how to revoke data access when it is no longer necessary?

Controllable: How much control do I have as a user? Can I freely enter into a Me2B Commitment or am I forced to give up some data just to find out what the Me2B Deal is in the first place? 

Abby’s other IA principles flow from the above considerations. A Useful product is one that does what it claims to do and communicates the deal you get clearly and accessibly. A Credible product is one that treats the user with respect and communicates its value. With user Control over data sharing and a clear understanding of the service being offered, the true Value of the service is apparent.

Over time the user will come to expect notice of potential changes to commitment states and will have agency over making that choice. These “Helpful Patterns”—clear and discoverable notice of state changes and opt-in commitments—build trust and loyalty, leading to a Delightful, or at least a reassuring, experience for your users.

What I’ve learned from working in the standards world is that Information Architecture Principles provide a solid framework for understanding digital relationships as well as structuring meaning. Because we aren’t just designing information spaces. We’re designing healthy relationships.


1 Levinger, G. (1983). “Development and change.” In H.H. Kelley et al. (Eds.), Close relationships (315–359). New York: W. H. Freeman and Company. https://www.worldcat.org/title/close-relationships/oclc/470636389

2  Asimov, I. (1950). I, Robot. Gnome Press.

Keep On Trackin’

Me2B Research: Consumer Views on Respectful Technology

In the research I’ve been doing on respectful technology relationships at the Me2B Alliance, it’s a combination of “I’ve got nothing to hide” and “I’ve got no other option”. People are deeply entangled in their technology relationships. Even when presented with overwhelmingly bad scores on Terms of Service and Privacy Policies, they will continue to use products they depend on or that give them access to their family, community, and in the case of Amazon an abundance of choice, entertainment and low prices. Even when they abandon a digital product or service, they are unlikely to delete their accounts. And the adtech SDKs they’ve agreed to track them keep on tracking.

Downward Dot Voting

My friend Austin Govella wrote today on using a kind of whole-body dot voting to teach teams to “Vote With Your Feet“. We are in a Liminal Thinking group on Facebook where he initially threw his ideas around. I was excited that he chose to add my comment about using negative dots to vote down ideas, and use them in my undergraduate UX class as a discussion point about what we Won’t do or talk about on a project.

My students get to use dot voting on the first day of our UX/UI class at CUNY CityTech, where we talk about what we are worried about for the upcoming semester. Addressing concerns and potential problems is a good exercise in most occasions, but in these days of online classes, crushing economy and pandemic, talking about our worries is particularly important. It helps to alleviate anxiety and develop a growth mindset toward the months ahead.

In this first class, the students learn about a number of design practices using a shared, online whiteboard, including brainstorming, dot voting, cluster analysis, and Kanban as part of a pre-mortem exercise on what can go wrong with the class. (I learned this exercise while teaching with Jimmy Chandler at the New York Code and Design Academy and modified it for online classes).

To begin, students use virtual sticky notes to write down their concerns about the coming semester. Then the students attach green and red mini circles, three each, to vote on which issues they want to discuss and which ones they don’t. Then we use Kanban (To do, Doing, Done) to keep the discussion orderly.

When I used the technique earlier on, I allowed each student three dots to vote on ideas that they want to discuss. There are usually concerns expressed that are common students commuting to our downtown Brooklyn campus, like getting to class on time (what if the subway breaks down? what if my work goes overtime?), having too much homework (it is a lot of homework, tbh), or dealing with a teammate that doesn’t pull their share (this happens on the job, too, unfortunately). It was OK. But these concerns, being fairly common are covered in the syllabus in the items about time management, group behavior and attendance, so the discussion becomes somewhat procedural.

There are of course new and now-common issues this semester about logging into school instead of commuting, managing family and job expectations, particularly for those students whose families rely on their job income and dealing with the combined stress of school, real and potential loss of family members (at least two of my students had a COVID death in the family and many have been displaced or ill), and just living in the 2020 political and budgetary climate. These issues are very personal and went largely unspoken but manifested as concerns about deadlines, time management and doubts that they have the skills it takes to be successful.

By allowing the students to select some issues that are not particularly a concern was a new idea and I found it especially interesting to explore them with the class. So along with items that have a lot of upvotes, I also selected items that have some upvotes, but also a few downvotes (more than one downvote, so as not to put any one person on the spot).

“Not a Concern” is key phrasing. For the upvote dots, I told the students to “mark items they want to talk about.” For downvote dots, the instructions are “mark items that are Not a Concern.” Te fact that someone wrote the issue on a sticky note in the first place means it is a concern for some students. I inferred from the “Not a Concern” votes that maybe there are people who have discovered ways to deal with the problem.

And for a teacher, it highlights differences in each class (there are always differences) that point to certain pedagogical approaches. For instance in one section the most up-voted concern was “potential weakness in design skills.” In the other section, a similar issue got a lot of down-votes. I wanted to know what was going on so made sure to expand on that concern in the second week’s discussion and begin a discussion of skills development, the importance of practice, and imposter syndrome.

This then becomes an opportunity for a discussion of growth. I tell them to ask themselves, How can I, as a student in a rigorous BFA program, discover ways to develop perspective so I understand where the doubt is coming from? How can I build confidence? Through practice, time management and simply being honest about the particularly stressful challenges this world is throwing at us and asking for help.

So cheers to Austin for giving me a fun topic to explore here. While you are at it, you can find his book, Collaborative Product Design at https://www.agux.co/cpd.

No Longer, Not Yet

Hex & Co game cafe planned to move from its current location on Broadway and 112th to Broadway and 114, the site of The West End Gate near Columbia University.

Today I had a dentist appointment. There weren’t any open appointments until October, but they had a cancelation, so I took it. I had just been there two days ago with my grown children, each reporting wisdom tooth pain, lost fillings and sensitivity. Mine pain was attributed to “Coronivirus Stress”. It’s something supposedly very common whether you’ve had the disease or not. Dr Cheung said he has it, too. No one is immune from dental stress these days. He recommended a night guard. And now I was heading back for a cleaning.

Taking a Lyft the other day, after a three month break from automobiles was strange. Traffic seemed to be going too fast and close for comfort. I didn’t want to touch the seat belt. Or the handle. Or the seat. This time, I decided to walk to West 79th Street this time and set out early for 40 minutes of late morning exercise.

Storefront with scaffolding and a torn For Rent sign

It’s been so hot in New York, but the air was cool today. I walked over to Broadway and then down and across at West 97th before taking Amsterdam Avenue the rest of the way.

At this time of day, essential workers are readying stores and restaurants for lunchtime sidewalk service and street-side dining. Areas in the near lane of the road, tented or open are set with tables and chairs, not quite 6 feet apart, and surrounded by 18 inch planter barriers, some already planted but most empty and awaiting something cheery.

Many of these settings cleverly expand into space unoccupied by the adjacent store, boarded up or dark and bearing a “For Rent” sign. I counted a lot of closed up stores on my walk.

Lulu lemon store “opening early Summer 2020”, has been shuttered since March.

As I stood waiting for the walk sign to light, I was thinking about these boarded up places. Especially the ones that have “Coming Soon” signs, offering hope but already beginning to fade.

On these New York streets, dry cleaners and restaurants have closed. In the operating businesses, behind the plexiglass of the curbside, contactless payment center, lie abandoned spaces where patrons used to eat.

Many have gone out of business. We aren’t allowed to dine in these days, and the streetside capacity is too low for them to make a profit, so they remain closed or close for good. Anyway, The 18 inch planter barriers aren’t exactly cheap. And you don’t need to clean a “Zoom shirt” that often.

Architecture_MPS, a research group where I manage social media, had an article some years ago called “No Longer and Not Yet” by Edward Hollis. It’s about a seminary near Glasgow that was built in the 1960s but abandoned almost immediately. What happens when there is no more use for a place?

As the light changed, I looked up and saw a young, nicely dressed woman, awkwardly carrying a magazine file full of Manila folders and a potted plant. She was wearing a mask, like most do these days, so I couldn’t judge her expression. Her eyes were watchful, dry. Perhaps she was just let go from her job. Or on her way to set up at a new one.

Another store. Another job. Coming soon.

The images for this story were taken by Noreen Whysel on July 16, 2020 near Columbia University. Each of these sites except The Vitamin Shoppe has been closed since the state PAUSE in March 2020.

IA Conference in Quarantine: On-Site to Online in 30 Days

The IA Conference ended its four week run, which as some of you may recall was originally a five day event In New Orleans with 12 preconference workshops and 60 talks in three tracks. The format changed to all prerecorded talks released in three tracks daily over a period of three weeks. We put the plenaries on Mondays and Fridays and special programming, like panel talks and poster sessions, on Wednesdays. We used Slack for daily AMAs and Zoom for weekend watch parties and Q&A sessions with plenaries. Other social and mentoring activities took place mornings, weekends and evenings.

The workshops which usually come first were all moved to the fourth week except for Jorge Arango’s IA Essentials. We had a lot of student scholarship attendees and didn’t want to make them wait until after the main conference.

We have a lot of amazing people to thank for puling it off, starting with dozens of volunteers whose stamina is inspiring. I honestly wasn’t sure we could hold people that long. But Jared Spool thought we could do it and Cheryl at Rosenfeld Media gave us some valuable advice about connecting through online platforms.

So, what did we do? Check out this presentation “Rapid Switch: How we turned a five day onsite event into a monthlong, online celebration,” presented at the 500 Members Celebration of the Digital Collaboration Practitioners.

Checking In: Coronavirus Edition

One of my startup groups suggested doing a check-in last week and one of the things I noticed In everyone’s worries was speculation about how markets might behave and comparisons to earlier periods of economic turmoil. I’ve been through 1987, 9/11 and 2008, so weighed in with my perspective.

The full effect of the 87 crash hit in 1990 right after I graduated from Columbia. Most of the companies I “interviewed” with at the career center admitted they weren’t hiring any time in the future. So, I temped my way to my first job at a small investment bank that went under within six weeks. I temped some more through most of April before landing an entry-level job in Business and Real Estate Valuation at Price Waterhouse. 9/11 pretty much ended my time there.

What I learned from that experience is that changing up your environment and learning how people do things at different companies is a good thing.

I did weird little jobs like stuffing gift boxes of logo socks at Ziff-Davis, cataloging buttons or prepping trunk shows at Chanel and a lot of phone banks and accounting. I learned a lot of software, and got pretty good at them.

I learned about how relationships work in business and solving problems, from the Chanel Boca Raton store dealing with button theft to fulfilling sweepstakes prizes and basic time and expense tracking. Plus if I ever got cold at Chanel I could always “go grab a sweater.”

9/11 was a weird time and very similar to now. Air travel was shut down. Bridges and tunnels were closed to private vehicles. Manhattan at least was pretty much on lockdown for three months. If you lived below 14th Street you had to evacuate.

Stores were open and I don’t remember a lot of hoarding. (I could be misremembering. I had a running drugstore.com diaper order so was probably pretty well-stocked, regularly). I remember hearing figures like $20 billion in losses just in NYC.

We didn’t have social distancing. That would have been devastating. There was a lot of bonding with neighbors and coworkers I hadn’t really known that well.

I was at PwC then, working remotely for the global web team, mostly operations and reporting. Some of my coworkers who worked out of the Jersey City office saw the towers go down. I had been going in for biweekly Tuesday all hands meetings, but that day was the alternate Tuesday, so I was home with my kids, getting my oldest ready to go meet her first preschool teachers.

We could go outside. The weather was beautiful, and so quiet. I remember a conversation in Sheep’s Meadow with a coworker who was losing her faith. I’d like to think I helped her.

In 2001, were already downsizing our department at PwC, so when I learned we were giving sublease space back to Lehman Brothers, I figured correctly I’d get laid off. That happened in January 2002.

By 2008 I had two school age kids and a part time contract at a virtual association. I had freelance design and technology gigs, too. We had just bought an apartment at the top of the market, but had sold our old one at a near 300% gain over ten years. So we felt secure.

But 2008 meant layoffs and job changes for my husband, who was at Citibank, then Ziegler, then BMO. We are pretty frugal but it’s amazing how much you can spend to live in this city. He is now a full time professor at BMCC. I teach two design classes at CityTech and advise a lot of startups and nonprofits. We’ve cut back, but we have two kids in college now, so feeling very uncertain.

I expect we will probably hear a lot of comparisons to previous disasters. It feels like potentially very different this time.

9/11 was shocking. We were in mourning. Thousands of lives. Everyone knew someone who knew someone who died. It’s going to be the same for us, but it’s going to happen over a longer period of time, and we may not be able to predict who it will be or when.

That by itself is going to mean a lot of mental anguish and a lot of business lost. Hospitality may get its bailout, but how long before people are comfortable traveling again? We may all get our “two weeks pay” from the Feds. Then what?

We startup entrepreneurs and business owners need to brace for it. We need to brace for limited funding opportunities. We need to reach out to each other and partner, do in-kind swaps. We need to share info on grants and other opportunities.

We can’t hold hands or hug anyone anymore, but we can stay connected and check in with each other.

Here’s my check-in:

Going Well: Working on transitioning a three day, three track, all volunteer, live conference to virtual and it is actually going well! I also have my kids home from college, and Simone has been baking!

Excited about: The Information Architecture Conference. My grandnephew, born this past Friday. Moving my classes at CityTech online, and, somewhat ironically, how the fact that isolation breeds misinformation makes Mucktracker, the news literacy app I’m working with, much more prescient and needed.

Nervous about: The conference. My parents. How long this social distancing will last, wifi bandwidth, my IRA, running out of TP.

So that’s my check-in. How are you doing? I have been working from home since 1997, so can offer tips to anyone finding themselves out of the office or incubator spaces for the duration. Feel free to post your check-in and questions in the comments.

Please Drive Slowly on Neutral Ground

August 26, 2019 NOLA Ready Alert instructing residents regarding parking restriction lift during flood warning.

My son, Jay, is a sophomore at Loyola University in New Orleans, so the worrywart parent I am signed up for NOLA Ready alerts to track emergencies during hurricane season. The above flash flood alert caught my eye, particularly the reference to parking restrictions on sidewalks and neutral grounds. Flooding in New Orleans streets can get dangerous so the city allows residents to to park cars in neutral areas during heavy rainfall.

The phrase “neutral ground” caught my eye in particular. I am co-chairing the Information Architecture Conference this year, in charge of Experience, so I’m interested in spotting terms that might be unique to New Orleans.

One of Jay’s favorite places to hang out in the Uptown neighborhood is called Neutral Ground Coffeehouse. It’s a place where people of all ages can gather, sip coffee, listen to live music and generally enjoy themselves. Like Temple Sinai on Charles Street across from Loyola’s Jesuit campus, Neutral Ground is a place where a Jewish kid from New York City can find some familiar culture and feel at home, with nightly programming, a weekly poetry hour and open mic on Sundays.

The phrase “Neutral Ground” didn’t seem particularly unique as far as two word phrases go. Other than the clever play on coffee “grounds” it never occurred to me that “Neutral Ground” had a specific meaning in New Orleans history.

On the NOLA Ready alert, neutral ground refers to the grassy median space between the lanes of major streets. On lanes where the city’s iconic streetcars run there are expanses of neutral ground that accommodate the trains with additional buffers. The area may or not be elevated from the main street level, but with the sidewalks, they provide a place for cars to park during heavy storms. We found ourselves waiting in these areas for traffic to pass at several intersections where they do not have many traffic lights or pedestrian signals.

Canal Street Mid City Neutral Ground. Photo by Infrogmation of New Orleans, December, 2016. https://commons.wikimedia.org/wiki/File:Canal_Street_Mid_City_Neutral_Ground_Dec_2016.jpg

A 2017 Times-Picayune story describes the original Neutral Ground as the center of Canal Street, which represented the division between the historically French and Anglo-American sections of the city. The French Quarter is on the north side of the divide and represents the First Municipality which was settled by French Creoles in the early Eighteenth Century. The Second Municipality, on the south side where the Central Business District is today, was settled by English speaking people after the Louisiana Purchase in 1803.

Below is an 1798 map showing the French Quarter and fortifications. The diagonal line to the left of the quarter is the boundary of an adjacent plantation, owned by John Greamer and his brother.

New Orleans in 1798 in accordance with an ordinance of the Illustrious Minustry and Royal Charter (as reprinted in the 1880s. Uploaded to Wikimedia Commons by user Infrogmation.. https://commons.wikimedia.org/wiki/File:NewOrleans1798_map.jpg

Below is an 1816 plan for New Orleans after the Louisiana Purchase was completed. The rectangular area at the peak curve of the Missisippi is the French Quarter. Canal Street is the leftmost street in the French Quarter area, one block to the right of the diagonal plantation boundary, now Common Street.

1816 Plan of the City and Enrirons of New Orleans, taken from actual Survey by Barthelemy Lafon, via book “Charting Louisiana, Five Hundred Years of Maps” edited by Alfred E. Lemmmon, John T. Magill and Jason R. Wiese, Historic New Orleans Collection, 2003. Posted to Wikimedia Commons by user Infrogmation.

Canal Street’s center divide was officially declared “The Neutral Ground” by the Daily Picayune on March 11, 1837 and the term has since been the general phrase to describe what most other places call the median.

I’m sure I’ll keep learning more New Orleans lingo in preparation for our conference in April. Just yesterday in a marketing team call, Joe Sokohl, our Experience Director who has family ties there, used the term “lagniappe,” another distinctively New Orleans term, derived from Quechua, to describe swag or giveaways we might provide at the IA Conference. I guess we all need a dictionary, so here’s a couple to keep up (these sites also have information for visitors):

Experience New Orleans, Say What?
http://www.experienceneworleans.com/glossary.html

New Orleans.com, NOLA Speak
https://www.neworleans.com/things-to-do/multicultural/colorful-words/

Disaster Planning at Woodstock – 50 Years in Review

Article updated on the event’s 50th Anniversary with images from Woodstock then and in 2011 when this piece was first published.

August 30, 2011

This past weekend, while Irene was threatening the East Coast, my husband and I were in the Catskills for visiting day at our daughters’ summer camp. We decided to extend our stay through Monday to avoid the surge and inevitable traffic delays following the storm’s projected landfall in New York City on Sunday.

Satellite image of Hurricane Irene on August 24, 2011 via Wikimedia Commons, https://upload.wikimedia.org/wikipedia/commons/thumb/8/8f/Hurricane_Irene_Aug_24_2011_1810Z.jpg/649px-Hurricane_Irene_Aug_24_2011_1810Z.jpg

Rather than avoid trouble, we found ourselves in the middle of it, as the Catskills experienced some of the worst storm-surge damage in the country: downed trees, road blocks, raging forest streams. If fact, a large white pine at the inn where we were staying fell inches from our unit’s porch, bringing several smaller trees down with it.

When it was safe to venture out, a trip to the Bethel Woods Museum at Bethel Woods Performing Arts Center, site of the 1969 Woodstock festival, interestingly, provided some perspective on disaster planning in the area.

Magic Bus. Image by Steve Brown https://www.flickr.com/photos/13111644@N00/9788610043

The Woodstock Music & Art Fair was held from August 15-18, 1969 at Max Yasgur‘s dairy farm in the hamlet of White Lake, Town of Bethel, Sullivan County, NY. We passed Yasgur’s farm several times while exploring the area’s restaurants and outdoor recreation facilities.

The area is marked by rolling pastures and clear lakes reflecting big white clouds in deep blue skies. Aside from a very visible lawn signs either declaring “No Fracking!” or “Friends of Natural Gas,” it seems little has changed in forty some years.

Museum artifacts on the planning of the Woodstock festival showcased the local debate regarding the chosen site of the concert. With over 200,000 tickets pre-sold, planning for traffic and security was a huge concern, as was local opinion on exactly what the festival was to be.

The festival organizers had mere days to move from Wallkill, NY where local opposition succeeded in preventing it from being held there to White Lake, where the Bethel Town Supervisor approved the plan despite some local protest. Newspaper articles and advertisements documented the debate.

Woodstock Ticket via Wikimedia Commons https://commons.wikimedia.org/wiki/File:Woodstock_ticket.jpg

Also on view were documents from the local Sheriff’s department outlining traffic and security plans and telegrams to other county departments requesting additional coverage. Handwritten notes and official telegrams from Allegheny County and other Sheriff departments indicated a shortage of officers. All stated that they could not spare any men.

Traffic was beginning to get backed up days before the concert started so that it became impossible to get close to the festival site. People were leaving their cars on the highway and walking the rest of the way to the concert. Performers were flown in and out again by helicopter.

An estimated 400,000 people were in attendance at the concert’s peak.

Then there came the rain. Though not hurricane force, the rains that fell on the Woodstock festival and in the week leading into it created saturated conditions, muddy roads and an already difficult traffic situation.

The audience at Woodstock waits for the rain to end, image by Derek Redmond and Paul Campbell, 1969 via Wikimedia Commons, https://commons.wikimedia.org/wiki/Woodstock#/media/File:Woodstock_redmond_rain.JPG

Officials had called in 150 state troopers, and deputies from adjacent counties ultimately did pitch in to direct traffic away from the area. The Evening News of Newburgh, NY reported that by the last day of the festival, mainly due to a lack of food and unsanitary conditions, the crowd had dispersed to only 10,000 and no traffic jams were reported.

This weekend’s storm called for similar measures, but on a much smaller scale. As we left the area, we noted state troopers and national guardsmen directing traffic near the interchanges of Route 17, I-87 and Route 6. Southbound traffic on I-87 was closed above the Tappan Zee Bridge and it was an hour drive between Route 17 and our usual favorite route, the Palisades Parkway.

At the Route 6 traffic circle near Bear Mountain, the Sloatsburg exit was entirely washed away.

Hurricane Irene Highland, NY flooding  via Wikimedia Commons, https://commons.wikimedia.org/wiki/File:Hurricane_Irene_Highland,_NY_flooding.JPG
Hurricane Irene Highland, NY flooding via Wikimedia Commons, https://commons.wikimedia.org/wiki/File:Hurricane_Irene_Highland,_NY_flooding.JPG
Deep gorge created in road after Hurricane Irene flooding in Ulster County, NY, via Wikimedia Commons, https://upload.wikimedia.org/wikipedia/commons/d/dd/Deep_gorge_created_in_road_after_Hurricane_Irene_flooding%2C_Oliverea%2C_NY.jpg

Could the traffic situation have been prevented? In 1969, the Sullivan County Sheriff’s Department was working with an estimate of 50,000 concertgoers, a figure provided by the promoters that was 150,000 short of pre-sales figures.

From what I’ve seen from this weekend’s rains, emergency services would already have been taxed from heavy rains and flooding in the region. Had they known that attendance would approach half a million people, it is likely that the concert would have been called off. That said, I doubt it would have stopped the hundreds of thousands of people from coming.

NYC Charter Revisions and GIS Oversight

Since well before 9/11, GISMO, the NYC region’s oldest GIS interest group, has been working on advocacy initiatives to improve the way New York City collects, stores, shares and manages Geospatial Data and the processes and strategies around the City’s Geographic Information Systems (GIS) and related functions. Beginning in 1996, the City’s first GIS Director, GISMO member Alan Leidner, held this role until his retirement from civic service in 2004. During his tenure, Leidner oversaw NYC’s emergency mapping program in one of the country’s most complicated rescue and recovery operations, the September 11, 2001 attack on the World Trade Center.

Just two years prior to 9/11, the City had launched a common base map for all agencies to use in GIS applications. Prior to the 1999 base map, there was little coordination between agencies on the underlying coordinates of various features on maps. As a result, data such as street center lines (which were available from the US Census though not always accurate) and building footprints would not match up with the level of accuracy needed for an effective response in an emergency situation. As City agencies created their own maps and datasets, using proprietary systems and software whose license agreements precluded data sharing, it was becoming increasingly difficult to form a common operating picture. This created difficulties for routine maintenance projects like coordinating access, excavation and repair of street corners and threatened larger operations.  After the World Trade Center attacks, when visible landmarks were no longer available, the new base map saved time, money and lives.

But things have changed since 2004. When Leidner retired, a new GIS Director was appointed, but he was not given the same level of responsibility and did not get the assistant commissioner title the post had carried previously. Laws providing the public open access to a multitude of agency datasets created a market for public information and tools created taking advantage of them. Mayor Bloomberg wrote an executive order that created the Mayor’s Office of Data Analytics, but the mandate did not cover the kind of sensitive data that would be required to handle multi-department programs and, crucially, emergencies. As a result response to events like Hurricane Sandy was fractured, affecting the ability of emergency services, DEP, MTA, ConEd and other entities to coordinate their activities.

GISMO recently published Guiding Principles and Policies for New York City’s Geospatial Architecture outlining its position on the role of geospatial technology and governance in NYC government. It presented the Principals and Policies work at a public forum at Hunter College in April 2018. GISMO further pursued its position that NYC must have a GIS Director and coordinating committee made up of GIS leads at all city agencies and is recommending a Charter amendment or legislation to make this happen.

GISMO posted its introductory statement, video and written testimonies regarding the proposed amendments to the New York City Charter at http://www.gismonyc.org/events/amend_nyc_charter/.  These testimonies were delivered to the New York City Council Charter Committee on April 30, May 2, May 7 and May 9, where several GISMO members, including myself, testified at the public hearings.

Through this Charter initiative we have advanced the cause of GIS in NYC by bringing our demands for better governance into the public forum. GIS saves lives, protects infrastructure, supports planning, improves City services, increases tax collections, and enhances economic development. We estimate that GIS at least doubles the analytic powers of traditional IT. We call on City government to recognize these facts and act accordingly.

You can find my testimony (gismonyc.org) and video (YouTube), starting at 02:25:15 but to get the full context, it’s best to review the statements in order. To explore how lives are saved by faster 911 response visit NYS GIS Association’s GISCalc tool created by Decision Fish, Results that Matter Team, and funded by the Fund for the City of New York.

If you are interested in learning more about GIS governance in New York City, contact GISMO at info@gismonyc.org or contact your New York City Council representative.