
In 2011, I participated in the NYC GeoSymposium 2001-2011-2021, which took a look at the advances and challenges of Geographic Information Systems in emergency response since 2001. I had been working with colleagues at GISMO for many years to draw attention to the important role geographers played in the 9/11 rescue and recovery. The GeoSymposium was a great experience, because it intended not just to honor those who participated in these efforts, but also to highlight the need to preserve the thousands of maps that tell the story.
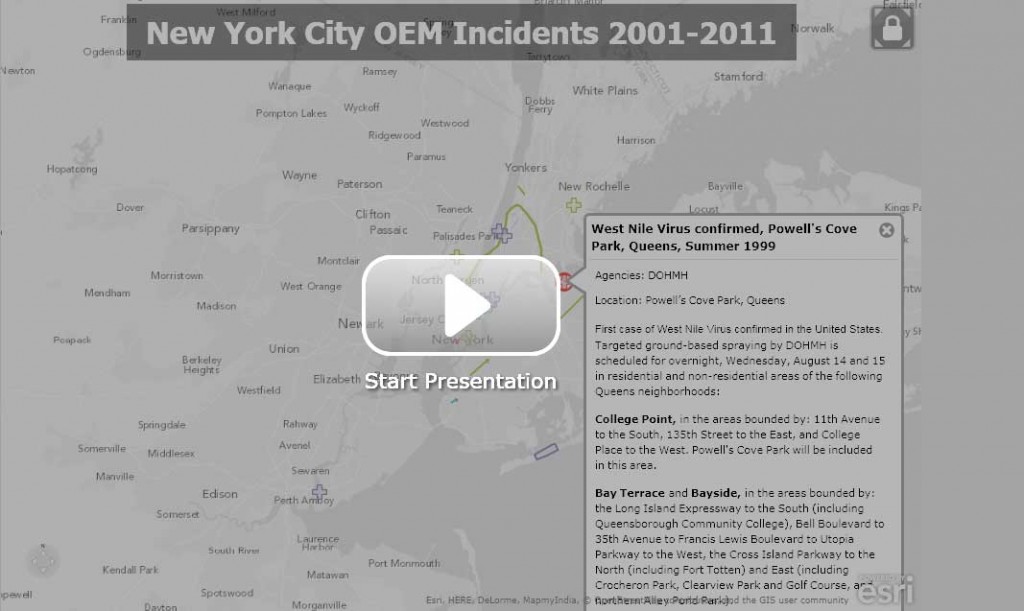
My own contribution to the GeoSymposium was to explore the legacy of these efforts by examining the technological improvements at the Office of Emergency Management in the context of emergency events that had occurred since 2001. I was looking for a way to present time-based information in a map format and also to start a conversation with attendees about the history of emergency response technology and the importance of the preservation of geographic artifacts. My project contained a map of New York City with events plotted and color-coded by discrete periods, characterized by a common group of new technologies. An online version of the map is available at ArgGIS Explorer Online.

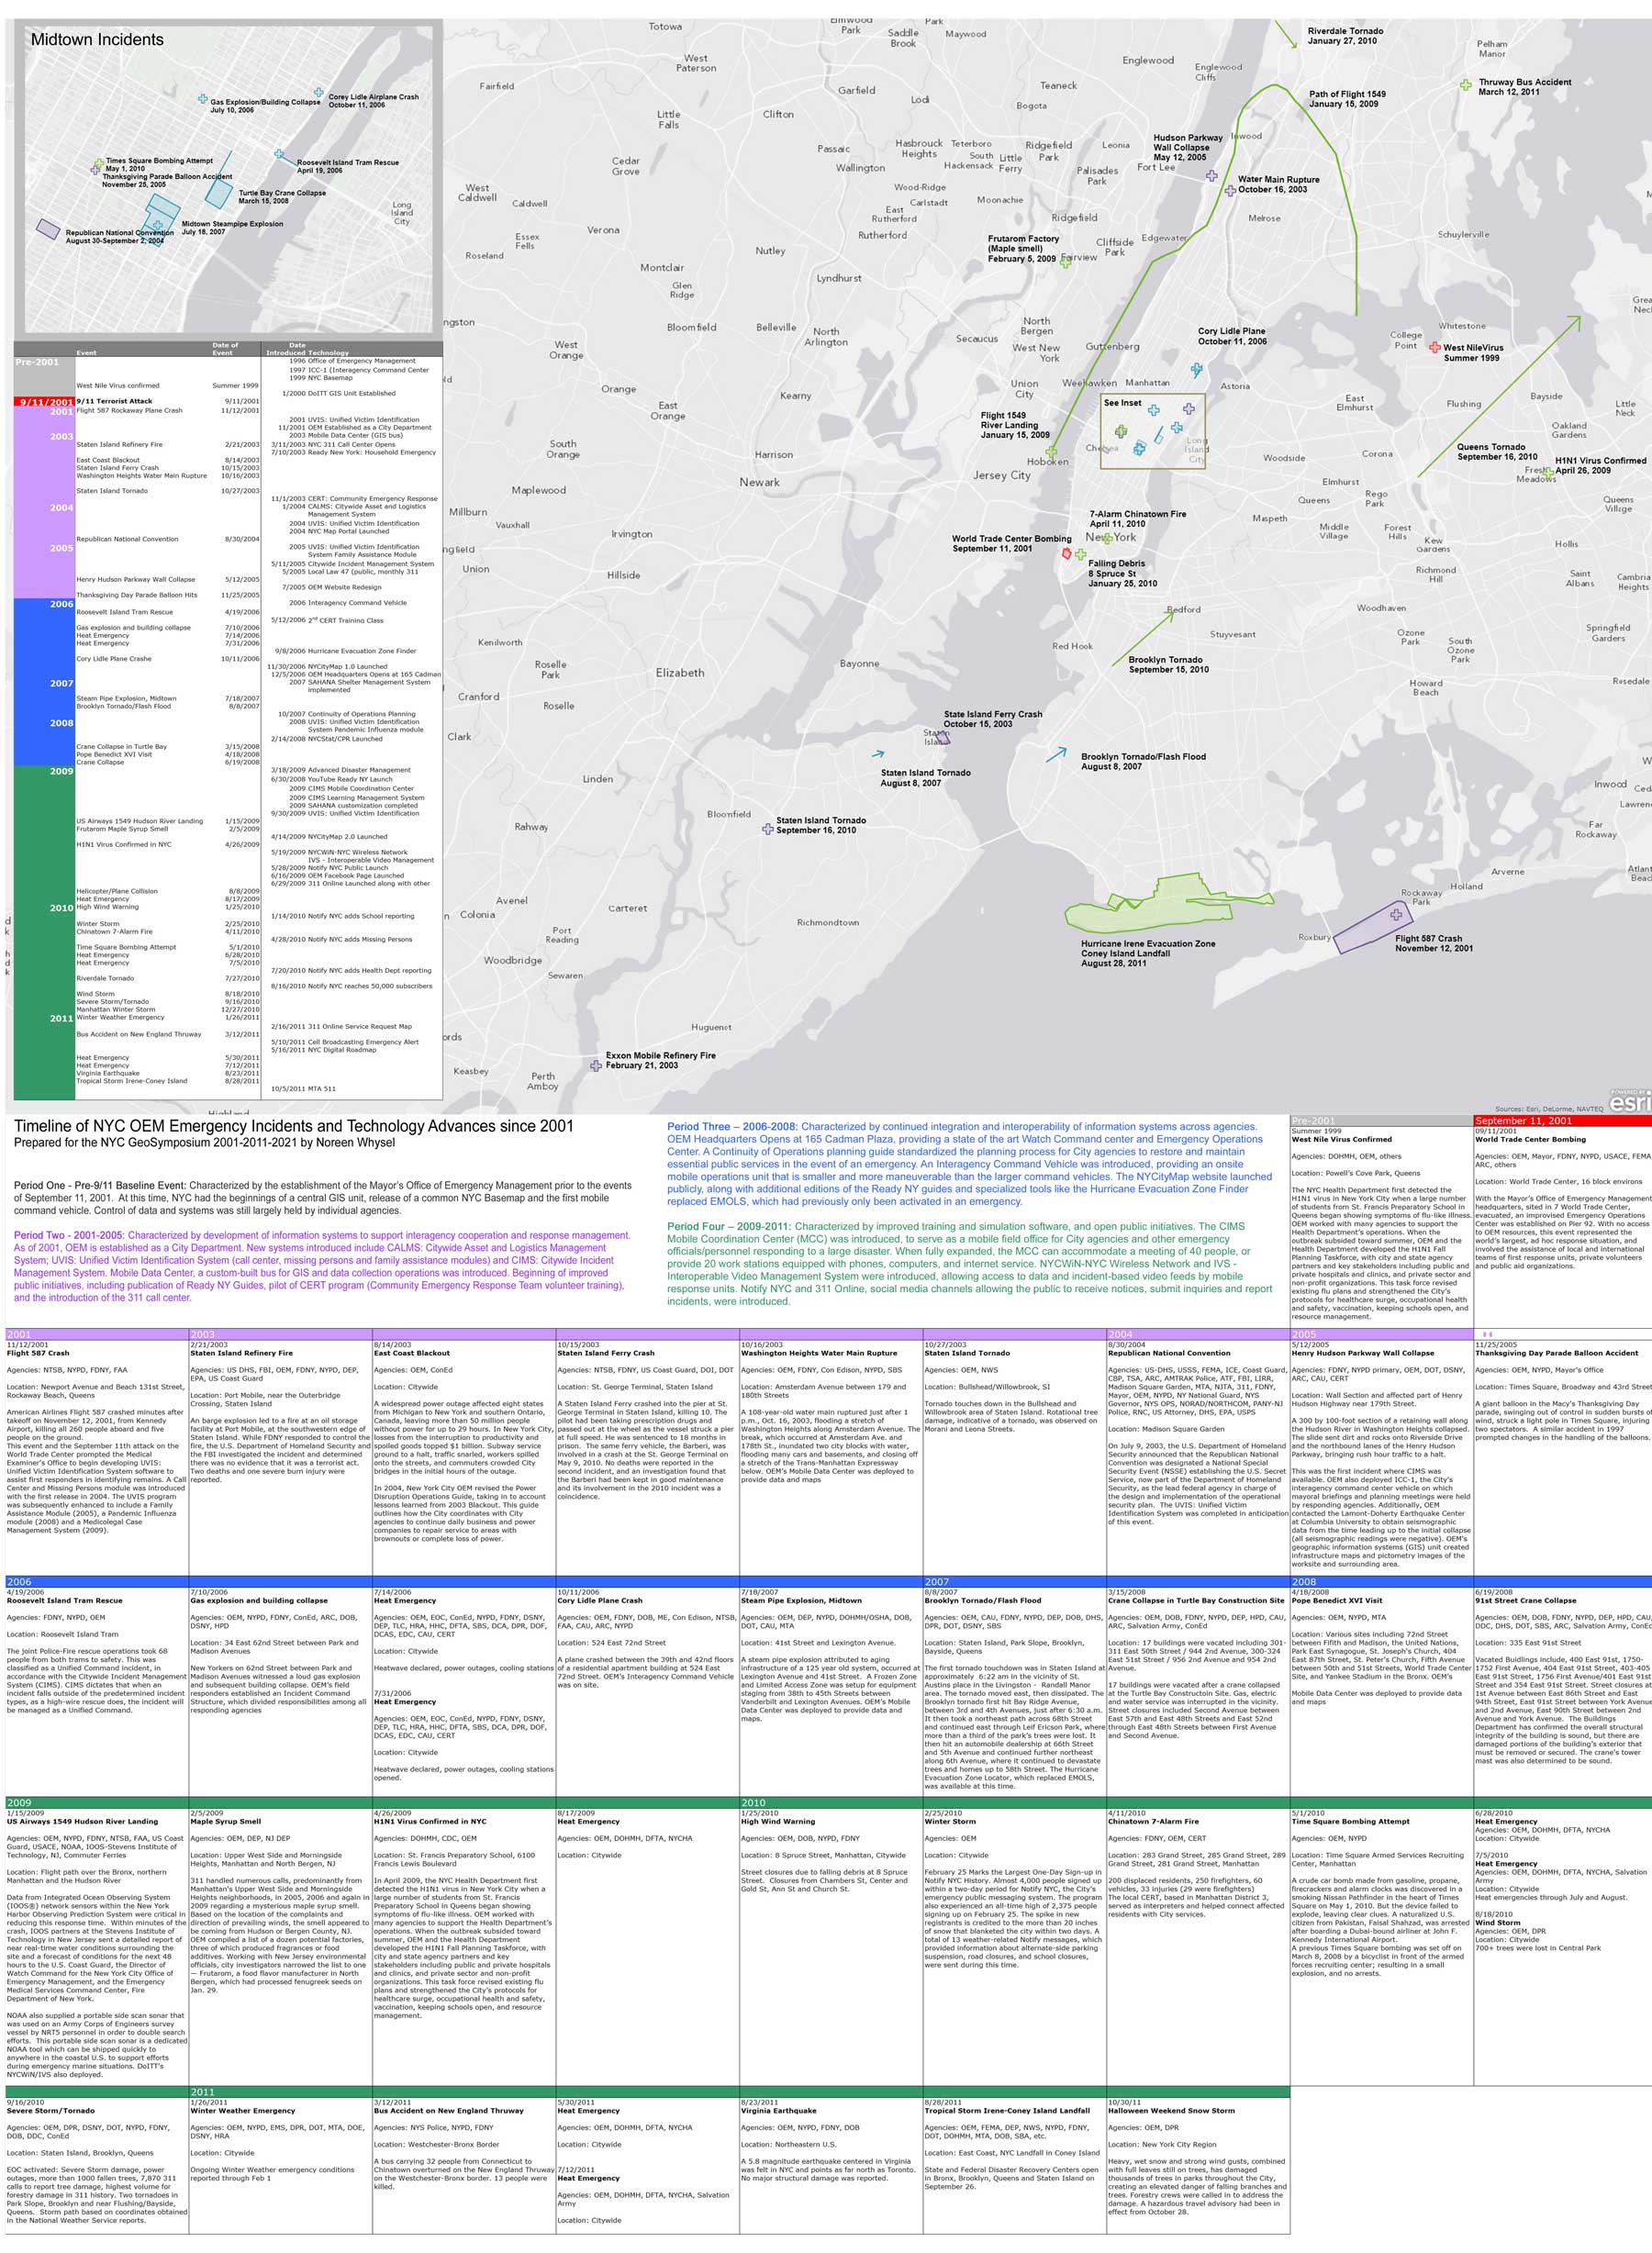
Download OEM Incident Map – Poster
Sample Slide:
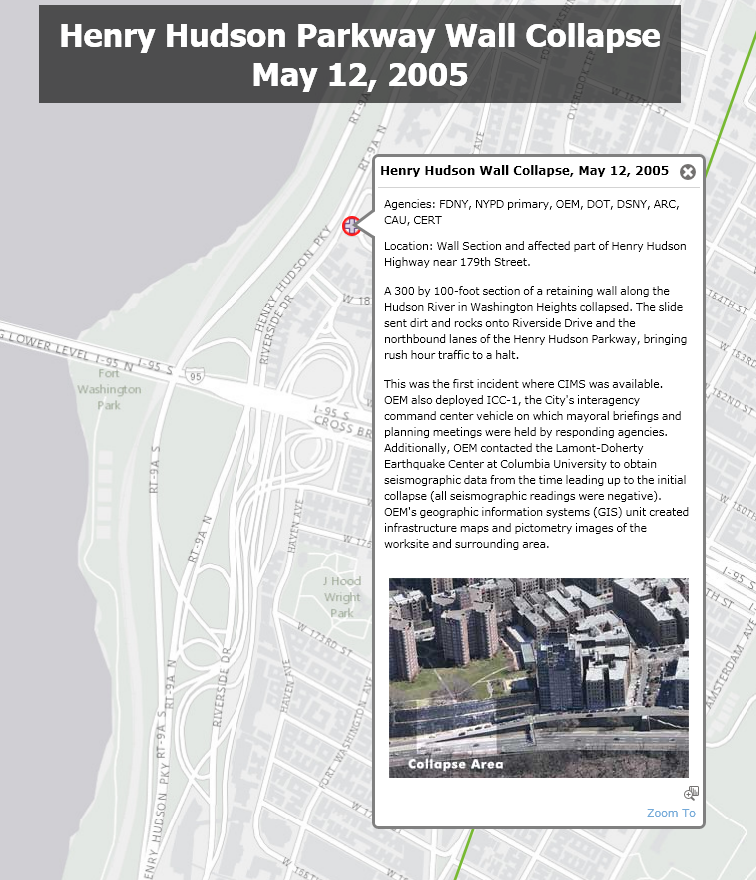
View Detail Slides (Requires Microsoft Silverlight)
The map highlights how the events surrounding 9/11 prompted improvements in incident management technology. Attendees, including the keynote presenter and eminent information designer, Edward Tufte, gathered around to discuss their experience with the events I had mapped and to offer advice on ways to enrich its design. (Some of Mr. Tufte’s comments led to further improvements which you can see via the links above.)
Simply talking about how to improve the map was an exercise in exploring history and memory: how people understand what happened, how events are related to one another, how what you choose to include and what not to include can influence a person’s understanding of the events, how the description of one event can bring to mind another similar one, etc. It was thrilling to observe the spontaneous conversation that started all because of a three by four foot piece of foamboard.
For more details and context around the planning for a 9/11 Map Archive, see my blog post, Towards a 9/11 GeoArchive.